
The New Commodity Supercycle: Why Energy and Metals Could Enter a Decade-Long Bull Market
- Hawkmont Research

- Mar 17
- 7 min read

Introduction: What is a commodity supercycle
A commodity supercycle is a prolonged, multi-year period typically lasting 10 to 30 years during which real commodity prices rise significantly above their long-term trend, driven by structural shifts in global demand that outpace the slow response of supply. Unlike short-term cyclical booms caused by temporary disruptions, supercycles reflect deep, secular changes in the world economy: rapid industrialization, urbanization, technological revolutions, or major geopolitical realignments. These episodes are characterized by sustained upward pressure on prices across broad baskets of commodities, including energy (oil, gas, coal, uranium) and industrial metals (copper, lithium, nickel, cobalt, aluminum), often accompanied by elevated volatility and investment surges.
Supercycles are inherently asymmetric. Demand surges quickly when large economies modernize or adopt new technologies, while supply, constrained by decade-long mine development timelines, declining ore grades, and capital-intensive infrastructure, lags. The result is a decade or more of structurally higher prices that reshape inflation dynamics, capital flows, and geopolitical power balances.
Historical commodity supercycles and their causes
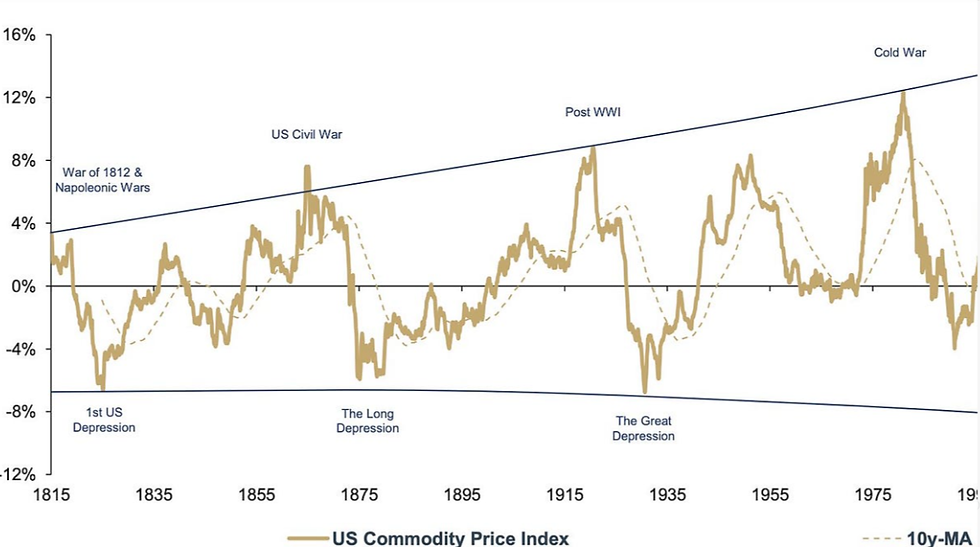
History offers clear precedents. Four broad supercycles have been identified since the mid-19th century, each lasting roughly 30 to 40 years with price amplitudes 20 to 40 percent above or below trend.
The first coincided with the Industrial Revolution and post-Napoleonic reconstruction (roughly 1890s to 1910s), fueled by European and U.S. railway and steel booms. The post-World War II supercycle (late 1940s to early 1970s) was propelled by reconstruction in Europe and Japan plus U.S. suburbanization and auto-driven oil demand. The 1970s episode (1971 to 1980) was triggered by the collapse of the Bretton Woods system, U.S. dollar depreciation, and the OPEC oil embargo, quadrupling crude prices and sparking stagflation. The most recent supercycle (roughly 2000 to 2014) was overwhelmingly demand-driven by China’s urbanization and industrialization: the country accounted for over 50 percent of global incremental demand for copper, iron ore, and coal during the peak years.
In each case, the common thread was a massive, unexpected demand shock colliding with inelastic supply. Lead times for new mines or oil fields averaged 10 to 15 years; ore grades declined; and capital spending responded only after prices had already risen sharply. The 2000s China cycle ended when massive new supply (especially in iron ore and coal) finally came online and Chinese infrastructure spending slowed.
Structural drivers of the next cycle
Today’s potential supercycle differs from predecessors: it is not driven by a single country’s catch-up industrialization but by multiple overlapping structural forces that are global and long-lasting. These include the energy transition toward net-zero emissions, explosive growth in artificial intelligence and data-center electricity demand, record infrastructure spending in both developed and emerging markets, and accelerating electrification of transport and industry. Unlike previous cycles, this one features policy tailwinds (Inflation Reduction Act in the U.S., EU Green Deal, China’s dual-carbon goals) that lock in demand trajectories for decades. Supply, meanwhile, remains hampered by chronic underinvestment since the 2014 commodity bust, ESG-driven capital constraints, and lengthening permitting timelines.
The International Energy Agency underscores the scale: energy-sector applications already drove 85 percent of incremental demand growth for battery metals (lithium, nickel, cobalt, graphite) in recent years, with copper demand surging from grid expansions alone.
Electrification and energy transition demand
Electrification sits at the core. The IEA’s World Energy Outlook projects global peak electricity demand rising around 40 percent by 2035 under Stated Policies, driven by cooling needs in emerging Asia, electric vehicle (EV) adoption, and grid modernization. Renewables (solar, wind) require 2 to 3 times more copper per megawatt than fossil-fuel plants; EVs need 2 to 3 times more copper than internal-combustion vehicles; and battery storage plus charging infrastructure add further layers.
Critical minerals demand is surging. Lithium demand jumped nearly 30 percent in 2024 alone, triple the 2010s average growth rate, while nickel, cobalt, graphite, and rare earths grew 6 to 8 percent. The energy sector accounted for the vast majority of this acceleration.
Compounding this is the AI-driven data-center boom. Forecasts project global electricity demand rising nearly 50 percent by 2040, with copper demand reaching 42 million metric tons annually, a 50 percent increase from current levels of roughly 28 million tons. Data centers alone could lift U.S. electricity consumption from 5 percent to 14 percent by 2030, requiring massive copper-intensive transmission and distribution upgrades.
Even in the IEA’s most aggressive net-zero scenarios, primary energy demand does not collapse; instead, the transition phase demands more total energy to build out renewable capacity and electrify end-uses before efficiency gains fully materialize. Oil and natural gas demand flatten or grow modestly into the 2030s under realistic policy trajectories, supporting energy commodity prices.
Supply constraints in mining and energy production
Supply is structurally constrained. New mine development still averages 15 to 20 years from discovery to production. Capital expenditure in mining rose only modestly after years of restraint, while exploration budgets have plateaued. Ore grades continue to decline across major copper and lithium districts.
The IEA’s Global Critical Minerals Outlook is explicit on copper: the current project pipeline points to a potential 30 percent supply shortfall by 2035, driven by declining ore grades, rising capital costs, limited new discoveries, and long lead times. Lithium markets appear balanced near-term but face deficits in the 2030s, though prospects for new projects are brighter than for copper. For other battery metals, announced projects meet demand only if they proceed on schedule, a big “if” given financing and permitting risks.
Energy production faces parallel headwinds. Oil majors have redirected capital toward renewables, leaving upstream investment below levels needed to offset natural decline rates (4 to 5 percent annually). LNG capacity expansions are substantial but front-loaded in the U.S. and Qatar; any delay risks price spikes. Uranium supply, critical for nuclear’s role in baseload power, remains tight after years of underinvestment.
Geopolitical resource competition
Geopolitics amplifies these constraints. Refining capacity for critical minerals is extraordinarily concentrated: China controls roughly 70 percent of global processing for most energy-related minerals. Export restrictions proliferated, covering more than 50 percent of energy-related minerals in recent years.
Western policies (U.S. Inflation Reduction Act “friend-shoring,” EU Critical Raw Materials Act) aim to diversify, yet new refining and mining projects in North America, Europe, and Australia face 50 percent higher capital costs and longer timelines. Competition for resources is intensifying: China’s Belt and Road investments secure African and Latin American supply, while the U.S. and Europe scramble for lithium in Australia and Chile, nickel in Indonesia, and cobalt in the Democratic Republic of Congo. Any escalation in trade tensions or regional conflict could trigger sharp price spikes.
Potential price implications for commodities
These forces point to a sustained bull market. Copper prices are already testing record highs on deficit signals; projections show a 10 million metric ton annual shortfall by 2040. Lithium and nickel could re-enter structural deficits by the early 2030s. Oil may trade in a higher range ($80 to 100+/bbl) as demand plateaus slowly and spare capacity remains thin. Uranium, already in a multi-year uptrend, benefits from nuclear renaissance narratives. Broad commodity indices could see real price levels 20 to 40 percent above the post-2014 average for much of the decade, classic supercycle territory.
Impact on global inflation and economic growth
Higher commodity prices will exert upward pressure on global inflation. Energy and metals feed directly into core CPI components (transport, housing, manufacturing). In the 1970s supercycle, this produced stagflation; today, with central banks more vigilant, the effect may manifest as persistently higher “inflation floors” and tighter policy. Emerging markets with commodity exports (Australia, Canada, Brazil, Chile, Indonesia, several African nations) will enjoy improved terms of trade, fiscal windfalls, and currency strength. Importers (Europe, India, parts of Asia) face headwinds unless they accelerate domestic production or recycling. Global growth could bifurcate: commodity producers outperform, while import-dependent manufacturers and consumers absorb higher costs.
Investment implications
For investors, the implications are profound. Traditional equity portfolios overweight technology and consumer discretionary may underperform relative to hard assets. Strategic allocations to commodities, via futures, ETFs, or direct mining equities, offer inflation hedging and diversification. Copper, lithium, and nickel producers with low-cost, geopolitically secure assets stand to benefit most. Energy majors with balanced upstream exposure and LNG portfolios also offer upside. Gold and silver, as monetary and industrial metals, provide additional ballast.
Tactical opportunities exist in exploration juniors and royalty/streaming companies, which historically deliver outsized returns in early supercycle phases. However, volatility remains high: short-term oversupply gluts can create buying opportunities before structural deficits reassert.
Final words
The confluence of unstoppable electrification demand, AI-driven power hunger, chronic supply underinvestment, and geopolitical fragmentation creates the preconditions for a new commodity supercycle lasting well into the 2030s. The IEA’s analysis, highlighting copper’s potential shortfall by 2035 and lithium deficits thereafter, confirms that markets are not yet pricing in the full scale of the challenge.
While short-term price corrections are inevitable, the decade-long structural bull market in energy and metals appears increasingly probable. Investors and policymakers who position for scarcity rather than abundance will be best placed to navigate the coming era of resource competition and higher commodity prices. The next supercycle is not a forecast; it is already underway.
Disclaimer
The information contained in this research report ("Report") is provided by Hawkmont Research, a global macro research firm, for informational purposes only and is not intended to constitute investment, financial, legal, tax, or accounting advice. This Report does not represent an offer or solicitation to buy or sell any securities, financial instruments, or investments, nor does it form the basis of any contract or commitment.
All opinions, estimates, projections, and analyses expressed in this Report are those of the authors as of the date of publication and are subject to change without notice. They are based on sources believed to be reliable, but no representation or warranty, express or implied, is made regarding the accuracy, completeness, or suitability of the information. Past performance is not indicative of future results, and actual outcomes may differ materially from those forecasted due to various risks, including but not limited to geopolitical developments, economic conditions, market volatility, regulatory changes, and unforeseen events.
Forward-looking statements in this Report, including price scenarios, economic forecasts, and investment implications, involve known and unknown risks and uncertainties that could cause actual results to vary significantly. Readers should not place undue reliance on such statements. Hawkmont Research assumes no liability for any errors, omissions, or inaccuracies in the Report or for any decisions made based on its content.
This Report may discuss specific securities, sectors, or markets, but such discussions are not recommendations to buy, sell, or hold. Investors should conduct their own due diligence and consult with qualified professionals before making investment decisions. The Report is not tailored to any individual's financial situation, objectives, or risk tolerance.
Data and charts are derived from publicly available sources and may include estimates or projections. Citations and references are provided where applicable, but Hawkmont Research does not guarantee their ongoing availability or accuracy.
Distribution of this Report is subject to applicable laws and regulations. It is not directed to any jurisdiction where its distribution would be prohibited. By accessing or using this Report, you agree to these terms.
